"LED fog lights rapidly emerging as the new choice of customers"
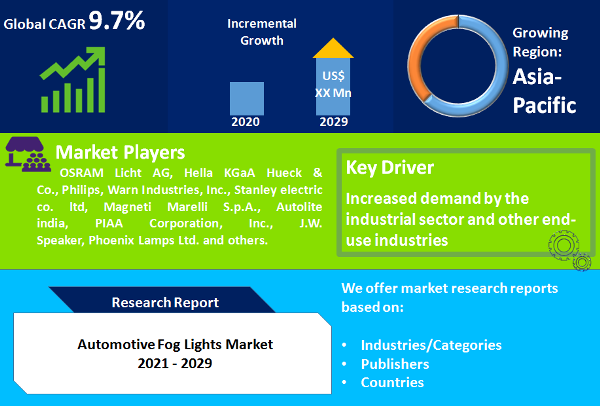
The automotive fog lights market worldwide is expected to grow with a CAGR of 9.7% during the forecast period from 2019 to 2027, starting from US$ 667.0 Mn in 2018. Automotive fog lights is useful in different climatic conditions such as during fog or heavy rains and low light conditions. There are different types of fog lights available in the market such as LED, halogen and HID, with LED rapidly emerging as the most popular type on account of sleek design, long lifetime and more brightness. Subsequently, LED lights have emerged as the new face for fog lights. New technology such as Bluetooth connected lights are also giving boom to the market. Bluetooth-enabled fog lights incorporate added functionality in correlation with the vehicle’s music system, thereby offering more enhanced appearance. Moreover, the changing spending pattern of consumer towards automotive accessories is another supporting factor for the automotive fog lights industry.
"LED Lights segment to emerged as the market leader"
Currently, halogen fog lights segment leads the market due to their predominance in the market and low cost. Nevertheless, LED fog light segment will hold a prominent share in the forecast period due to its growing adoption and change in the safety measures of automotive industry. LED fog lights offer different benefits such as more brightness, less energy consumption, longer lifespan, clear picture of the road and various others. As compared with HID and halogen, LED fog lights are expensive but consumers prefer these due to their advantages over conventional halogen and HID counterparts.
"Asia Pacific to Register the Fastest Growth in the Forecast Period"
In 2018, Europe led the fog lights market worldwide with nearly 42% of the global market revenue as front and rear fog lights are mandatory in the region. Since Asia Pacific is the largest market for automotive vehicles, auxiliary automotive accessories such as fog lights witness substantial penetration in the region. Additionally, growing discretionary income along with safety concerns has ensured robust demand for fog lights in the region. Considering the consistently growing automotive industry in Asia Pacific and a statement by International Road Federation urging mandate on front and rear fog lights, the region would exhibit highest CAGR through the forecast period.
Some of the prominent players operating in the automotive fog lights market include OSRAM Licht AG, Hella KGaA Hueck & Co., Philips, Warn Industries, Inc., Stanley electric co. ltd, Magneti Marelli S.p.A., Autolite india, PIAA Corporation, Inc., J.W. Speaker, Phoenix Lamps Ltd. and others.
Historical & Forecast Period
This research report presents the analysis of each segment from 2017 to 2027 considering 2018 as the base year for the research. Compounded Annual Growth Rate (CAGR) for each respective segments calculated for the forecast period from 2019 to 2027.
The automotive fog lights market report provides market size and estimates based on market dynamics and key trends observed in the industry. The report provides a holistic view of global automotive fog lights market based on position, type, color, channel, vehicle and geography. Key segments covered in the report are as follows:
ATTRIBUTE | DETAILS |
---|---|
Research Period | 2017-2027 |
Base Year | 2018 |
Forecast Period | 2019-2027 |
Historical Year | 2017 |
Unit | USD Million |
Segmentation |
Position (2019–2027; US$ Mn) |
Type of Fog Lights (2019–2027; US$ Mn) |
|
Color Type (2019–2027; US$ Mn) |
|
Channel (2019–2027; US$ Mn) |
|
Vehicle (2019–2027; US$ Mn) |
|
Geography Segment (2019–2027; US$ Mn) |
TABLE 1 Market Snapshot: Global Automotive Fog Lights (AFL) Market
TABLE 2 Impact Indicators
TABLE 3 Impact Analysis of Drivers and Restraints
TABLE 4 North America AFL Market Value, By Position, 2017 – 2027 (US$ Mn)
TABLE 5 North America AFL Market Value, By Product Type, 2017 – 2027 (US$ Mn)
TABLE 6 North America AFL Market Value, By Color, 2017 – 2027 (US$ Mn)
TABLE 7 North America AFL Market Value, By Channel, 2017 – 2027 (US$ Mn)
TABLE 8 North America AFL Market Value, By Vehicle Type, 2017 – 2027 (US$ Mn)
TABLE 9 North America AFL Market Value, By Region/Country, 2017 – 2027 (US$ Mn)
TABLE 10 U.S. AFL Market Value, By Position, 2017 – 2027 (US$ Mn)
TABLE 11 U.S. AFL Market Value, By Product Type, 2017 – 2027 (US$ Mn)
TABLE 12 U.S. AFL Market Value, By Color, 2017 – 2027 (US$ Mn)
TABLE 13 U.S. AFL Market Value, By Channel, 2017 – 2027 (US$ Mn)
TABLE 14 U.S. AFL Market Value, By Vehicle Type, 2017 – 2027 (US$ Mn)
TABLE 15 Rest of North America AFL Market Value, By Position, 2017 – 2027 (US$ Mn)
TABLE 16 Rest of North America AFL Market Value, By Product Type, 2017 – 2027 (US$ Mn)
TABLE 17 Rest of North America AFL Market Value, By Color, 2017 – 2027 (US$ Mn)
TABLE 18 Rest of North America AFL Market Value, By Channel, 2017 – 2027 (US$ Mn)
TABLE 19 Rest of North America AFL Market Value, By Vehicle Type, 2017 – 2027 (US$ Mn)
TABLE 20 Europe AFL Market Value, By Position, 2017 – 2027 (US$ Mn)
TABLE 21 Europe AFL Market Value, By Product Type, 2017 – 2027 (US$ Mn)
TABLE 22 Europe AFL Market Value, By Color, 2017 – 2027 (US$ Mn)
TABLE 23 Europe AFL Market Value, By Channel, 2017 – 2027 (US$ Mn)
TABLE 24 Europe AFL Market Value, By Vehicle Type, 2017 – 2027 (US$ Mn)
TABLE 25 Europe AFL Market Value, By Region/Country, 2017 – 2027 (US$ Mn)
TABLE 26 U.K. AFL Market Value, By Position, 2017 – 2027 (US$ Mn)
TABLE 27 U.K. AFL Market Value, By Product Type, 2017 – 2027 (US$ Mn)
TABLE 28 U.K. AFL Market Value, By Color, 2017 – 2027 (US$ Mn)
TABLE 29 U.K. AFL Market Value, By Channel, 2017 – 2027 (US$ Mn)
TABLE 30 U.K. AFL Market Value, By Vehicle Type, 2017 – 2027 (US$ Mn)
TABLE 31 Germany AFL Market Value, By Position, 2017 – 2027 (US$ Mn)
TABLE 32 Germany AFL Market Value, By Product Type, 2017 – 2027 (US$ Mn)
TABLE 33 Germany AFL Market Value, By Color, 2017 – 2027 (US$ Mn)
TABLE 34 Germany AFL Market Value, By Channel, 2017 – 2027 (US$ Mn)
TABLE 35 Germany AFL Market Value, By Vehicle Type, 2017 – 2027 (US$ Mn)
TABLE 36 U.K. AFL Market Value, By Position, 2017 – 2027 (US$ Mn)
TABLE 37 France AFL Market Value, By Product Type, 2017 – 2027 (US$ Mn)
TABLE 38 France AFL Market Value, By Color, 2017 – 2027 (US$ Mn)
TABLE 39 France AFL Market Value, By Channel, 2017 – 2027 (US$ Mn)
TABLE 40 France AFL Market Value, By Vehicle Type, 2017 – 2027 (US$ Mn)
TABLE 41 Rest of Europe AFL Market Value, By Position, 2017 – 2027 (US$ Mn)
TABLE 42 Rest of Europe AFL Market Value, By Product Type, 2017 – 2027 (US$ Mn)
TABLE 43 Rest of Europe AFL Market Value, By Color, 2017 – 2027 (US$ Mn)
TABLE 44 Rest of Europe AFL Market Value, By Channel, 2017 – 2027 (US$ Mn)
TABLE 45 Rest of Europe AFL Market Value, By Vehicle Type, 2017 – 2027 (US$ Mn)
TABLE 46 Asia Pacific AFL Market Value, By Position, 2017 – 2027 (US$ Mn)
TABLE 47 Asia Pacific AFL Market Value, By Product Type, 2017 – 2027 (US$ Mn)
TABLE 48 Asia Pacific AFL Market Value, By Color, 2017 – 2027 (US$ Mn)
TABLE 49 Asia Pacific AFL Market Value, By Channel, 2017 – 2027 (US$ Mn)
TABLE 50 Asia Pacific AFL Market Value, By Vehicle Type, 2017 – 2027 (US$ Mn)
TABLE 51 Asia Pacific AFL Market Value, By Region/Country, 2017 – 2027 (US$ Mn)
TABLE 52 China AFL Market Value, By Position, 2017 – 2027 (US$ Mn)
TABLE 53 China AFL Market Value, By Product Type, 2017 – 2027 (US$ Mn)
TABLE 54 China AFL Market Value, By Color, 2017 – 2027 (US$ Mn)
TABLE 55 China AFL Market Value, By Channel, 2017 – 2027 (US$ Mn)
TABLE 56 China AFL Market Value, By Vehicle Type, 2017 – 2027 (US$ Mn)
TABLE 57 Japan AFL Market Value, By Position, 2017 – 2027 (US$ Mn)
TABLE 58 Japan AFL Market Value, By Product Type, 2017 – 2027 (US$ Mn)
TABLE 59 Japan AFL Market Value, By Color, 2017 – 2027 (US$ Mn)
TABLE 60 Japan AFL Market Value, By Channel, 2017 – 2027 (US$ Mn)
TABLE 61 Japan AFL Market Value, By Vehicle Type, 2017 – 2027 (US$ Mn)
TABLE 62 India AFL Market Value, By Position, 2017 – 2027 (US$ Mn)
TABLE 63 India AFL Market Value, By Product Type, 2017 – 2027 (US$ Mn)
TABLE 64 India AFL Market Value, By Color, 2017 – 2027 (US$ Mn)
TABLE 65 India AFL Market Value, By Channel, 2017 – 2027 (US$ Mn)
TABLE 66 India AFL Market Value, By Vehicle Type, 2017 – 2027 (US$ Mn)
TABLE 67 Rest of Asia Pacific AFL Market Value, By Position, 2017 – 2027 (US$ Mn)
TABLE 68 Rest of Asia Pacific AFL Market Value, By Product Type, 2017 – 2027 (US$ Mn)
TABLE 69 Rest of Asia Pacific AFL Market Value, By Color, 2017 – 2027 (US$ Mn)
TABLE 70 Rest of Asia Pacific AFL Market Value, By Channel, 2017 – 2027 (US$ Mn)
TABLE 71 Rest of Asia Pacific AFL Market Value, By Vehicle Type, 2017 – 2027 (US$ Mn)
TABLE 72 RoW AFL Market Value, By Position, 2017 – 2027 (US$ Mn)
TABLE 73 RoW AFL Market Value, By Product Type, 2017 – 2027 (US$ Mn)
TABLE 74 RoW AFL Market Value, By Color, 2017 – 2027 (US$ Mn)
TABLE 75 RoW AFL Market Value, By Channel, 2017 – 2027 (US$ Mn)
TABLE 76 RoW AFL Market Value, By Vehicle Type, 2017 – 2027 (US$ Mn)
TABLE 77 RoW AFL Market Value, By Region/Country, 2017 – 2027 (US$ Mn)
TABLE 78 MEA AFL Market Value, By Position, 2017 – 2027 (US$ Mn)
TABLE 79 MEA AFL Market Value, By Product Type, 2017 – 2027 (US$ Mn)
TABLE 80 MEA AFL Market Value, By Color, 2017 – 2027 (US$ Mn)
TABLE 81 MEA AFL Market Value, By Channel, 2017 – 2027 (US$ Mn)
TABLE 82 MEA AFL Market Value, By Vehicle Type, 2017 – 2027 (US$ Mn)
TABLE 83 Latin America AFL Market Value, By Position, 2017 – 2027 (US$ Mn)
TABLE 84 Latin America AFL Market Value, By Product Type, 2017 – 2027 (US$ Mn)
TABLE 85 Latin America AFL Market Value, By Color, 2017 – 2027 (US$ Mn)
TABLE 86 Latin America AFL Market Value, By Channel, 2017 – 2027 (US$ Mn)
TABLE 87 Latin America AFL Market Value, By Vehicle Type, 2017 – 2027 (US$ Mn)
TABLE 88 Osram Licht AG: Company Snapshot (Company Details, Geographical Presence, Product Portfolio, Recent Developments)
TABLE 89 Hella KGaA Hueck & Co.: Company Snapshot (Company Details, Geographical Presence, Product Portfolio, Recent Developments)
TABLE 90 Philips: Company Snapshot (Company Details, Geographical Presence, Product Portfolio, Recent Developments)
TABLE 91 Warn Industries, Inc.: Company Snapshot (Company Details, Geographical Presence, Product Portfolio, Recent Developments)
TABLE 92 Stanley Electric Co. Ltd.: Company Snapshot (Company Details, Geographical Presence, Product Portfolio, Recent Developments)
TABLE 93 Magneti Marelli S.p.A.: Company Snapshot (Company Details, Geographical Presence, Product Portfolio, Recent Developments)
TABLE 94 Autolite India: Company Snapshot (Company Details, Geographical Presence, Product Portfolio, Recent Developments)
TABLE 95 PIAA Corporation, Inc.: Company Snapshot (Company Details, Geographical Presence, Product Portfolio, Recent Developments)
TABLE 96 J.W. Speaker: Company Snapshot (Company Details, Geographical Presence, Product Portfolio, Recent Developments)
TABLE 97 Phoenix Lamps Ltd.: Company Snapshot (Company Details, Geographical Presence, Product Portfolio, Recent Developments)