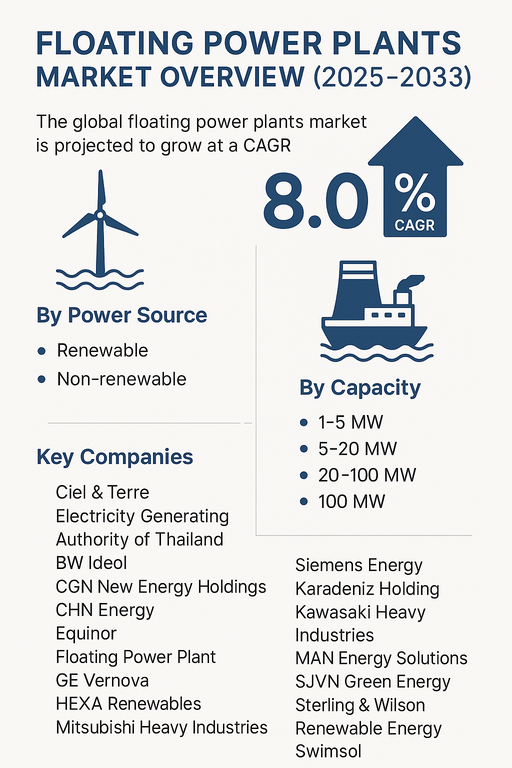
The global floating power plants market is projected to grow at a CAGR of 8.0% from 2026 to 2034, driven by rising global demand for flexible energy solutions, limited land availability for conventional power plants, and advancements in floating infrastructure. Floating power plants are designed to generate electricity on water bodies, leveraging renewable and non-renewable sources to provide reliable energy in regions with space constraints or urgent demand. Their scalability, mobility, and potential to integrate with renewable sources are key factors enhancing their global adoption.
Rising Need for Flexible and Sustainable Power Generation
Floating power plants are gaining traction as utilities and governments seek sustainable and space-efficient energy generation. The increasing penetration of renewable energy sources, especially floating solar PV and offshore wind, is accelerating market adoption. These installations reduce the burden on land resources while offering cost efficiency through shared grid connections and modular deployment. Non-renewable floating plants, including LNG and diesel-based barges, remain important for emergency power supply and remote regions where grid access is limited. Growing investments in hybrid floating platforms that integrate solar, wind, and storage are creating new market opportunities.
Challenges: High Installation Costs and Technical Barriers
Despite strong growth potential, the floating power plants market faces challenges such as high capital costs, complex installation requirements, and operational risks in harsh marine environments. Ensuring durability against waves, storms, and corrosion raises both engineering and maintenance costs. Additionally, integration with existing grid infrastructure and securing financing for large-scale projects remain barriers to faster adoption. Regulatory uncertainties and permitting delays also pose challenges in several regions. However, technological advancements, strategic partnerships, and supportive government policies are expected to ease these constraints and drive market expansion.
Market Segmentation by Power Source
By power source, the market is divided into renewable and non-renewable floating power plants. Renewable sources, led by floating solar and offshore wind, are expected to dominate growth due to global decarbonization initiatives and favorable policy support. Non-renewable floating plants continue to serve a significant role in providing flexible, fast-deployable power generation, particularly in island nations and regions with unstable grids.
Market Segmentation by Capacity
By capacity, the market is segmented into 1–5 MW, 5–20 MW, 20–100 MW, and above 100 MW. Smaller capacity plants (1–20 MW) are commonly deployed for island power supply and remote communities, offering rapid setup and mobility. The 20–100 MW segment is expanding in emerging economies for regional grid support, while above 100 MW plants are gaining attention in large-scale projects integrating offshore renewables and hybrid solutions.
Regional Insights
In 2025, Asia Pacific led the floating power plants market, with strong adoption in Japan, China, India, and Southeast Asian nations where limited land availability and high energy demand drive deployment. Europe is a frontrunner in offshore wind and hybrid floating energy platforms, with countries like Norway, Denmark, and the UK at the forefront. North America is witnessing increasing investments in floating solar and LNG-based floating plants, particularly in coastal regions. Latin America and Middle East & Africa (MEA) represent emerging opportunities, with floating renewables supporting electrification in remote and water-abundant areas.
Competitive Landscape
The 2025 market was led by a mix of global energy giants and specialized floating power plant developers. Ciel & Terre and Swimsol are pioneering floating solar PV solutions with large-scale deployments worldwide. Equinor, Orsted, RWE, and BW Ideol are major players in offshore wind-integrated floating platforms. Karadeniz Holding dominates the floating non-renewable power plant segment with its fleet of power ships deployed across multiple regions. GE Vernova, Siemens Energy, MAN Energy Solutions, Mitsubishi Heavy Industries, and Kawasaki Heavy Industries bring strong engineering expertise to large-scale projects. Regional leaders such as Electricity Generating Authority of Thailand, National Power Supply Public Company, Tata Power, and SJVN Green Energy are expanding adoption in Asia. Competitive strategies center on hybrid energy integration, large-capacity projects, partnerships, and innovations in floating infrastructure.
Historical & Forecast Period
This study report represents analysis of each segment from 2024 to 2034 considering 2025 as the base year. Compounded Annual Growth Rate (CAGR) for each of the respective segments estimated for the forecast period of 2026 to 2034.
The current report comprises of quantitative market estimations for each micro market for every geographical region and qualitative market analysis such as micro and macro environment analysis, market trends, competitive intelligence, segment analysis, porters five force model, top winning strategies, top investment markets, emerging trends and technological analysis, case studies, strategic conclusions and recommendations and other key market insights.
Research Methodology
The complete research study was conducted in three phases, namely: secondary research, primary research, and expert panel review. key data point that enables the estimation of Floating Power Plants market are as follows:
Market forecast was performed through proprietary software that analyzes various qualitative and quantitative factors. Growth rate and CAGR were estimated through intensive secondary and primary research. Data triangulation across various data points provides accuracy across various analyzed market segments in the report. Application of both top down and bottom-up approach for validation of market estimation assures logical, methodical and mathematical consistency of the quantitative data.
| ATTRIBUTE | DETAILS |
|---|---|
| Research Period | 2024-2034 |
| Base Year | 2025 |
| Forecast Period | 2026-2034 |
| Historical Year | 2024 |
| Unit | USD Million |
| Segmentation | |
Power Source
|
|
Capacity
|
|
Deployment
|
|
Application
|
|
|
Region Segment (2024-2034; US$ Million)
|
Key questions answered in this report


